NVDA 12/19/25
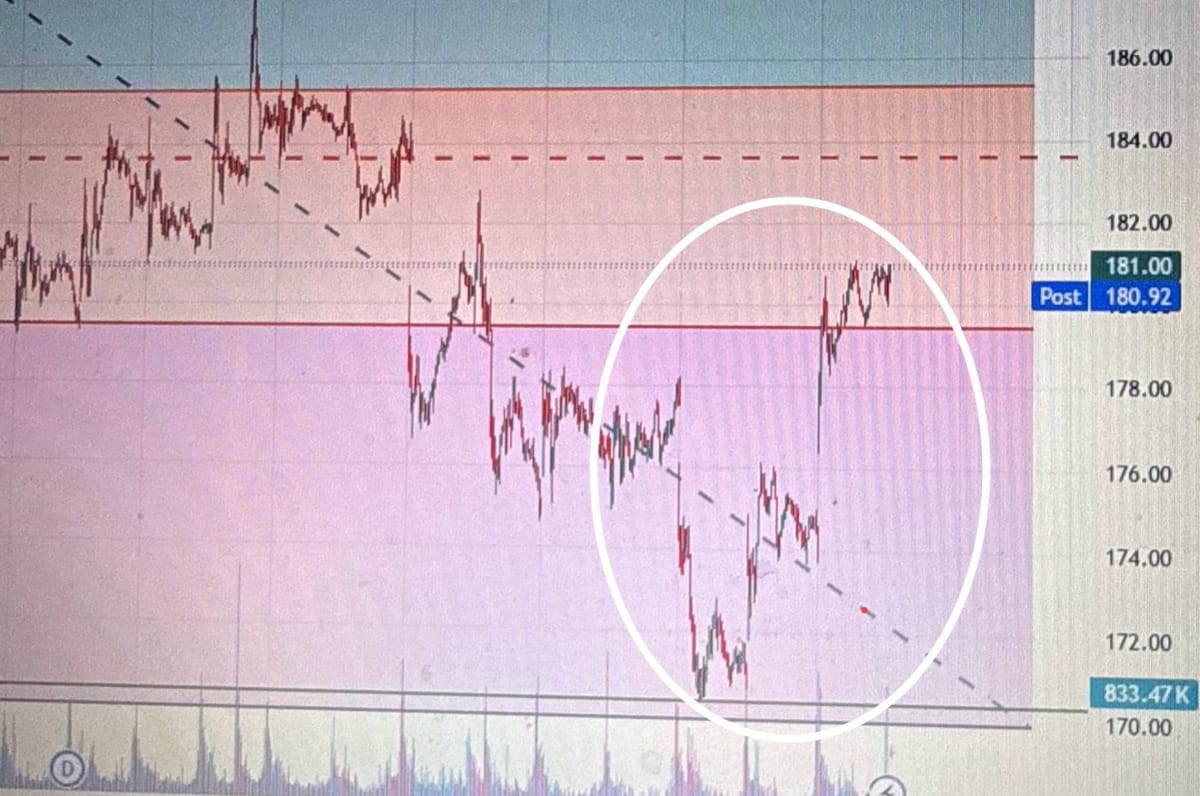
The chart illustrates a historical instance of price interacting with a downward-sloping trendline before transitioning into a higher trading range near the $180 price level. Within the circled area, price can be observed compressing near prior market activity before expanding into a broader range, a pattern commonly discussed in technical analysis education when examining how price has previously behaved around structural reference points. When the underlying ticker trades near levels such as $180, option contracts at that strike are often referenced as at-the-money benchmarks for discussing option sensitivity and liquidity, while higher strikes, including the $190 calls, may be cited comparatively to illustrate how additional strike distance is reflected in option pricing and implied volatility. This discussion is provided solely for general educational purposes and does not imply any forecast, recommendation, or expected outcome.